Why This Matters
LLM systems fail silently. Latency spikes, hallucinations, and broken prompts often go unnoticed until users complain. Traditional metrics like CPU or GPU utilization are not enough. You need observability that tracks the full request path and measures quality.
This post explains how to build observability for LLM systems using traces, evals, and quality SLOs.
What Is Missing Today
Token counts without context
No visibility into prompt to retrieval to inference flow
No automated evals for quality
No SLOs for correctness or safety
How to Build Real Observability
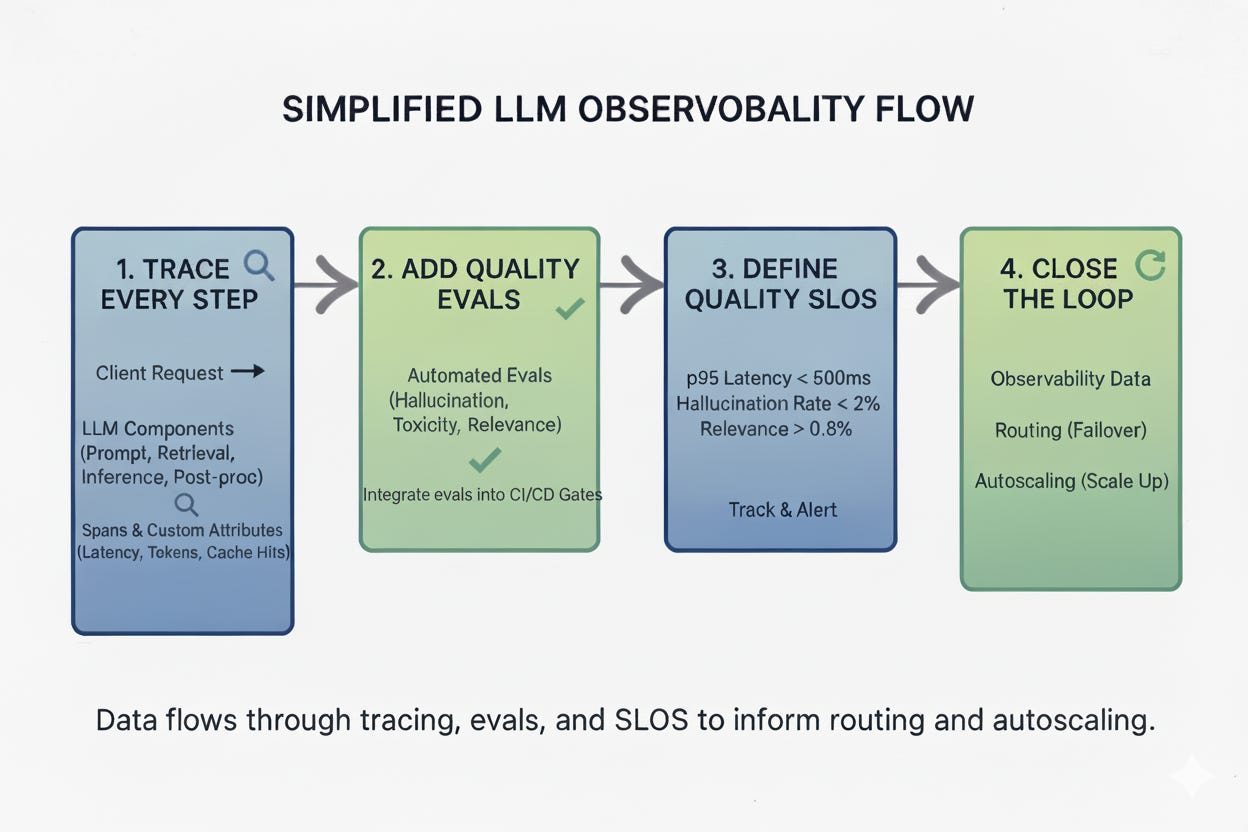
1. Trace Every Step
Capture spans for:
Prompt processing
Retrieval calls
Model inference
Post-processing
Use OpenTelemetry or similar frameworks. Add custom attributes like token count, latency per stage, and cache hits.
2. Add Quality Evals
Latency is not enough. You need correctness checks.
Golden datasets for regression tests
Automated evals for hallucination, toxicity, and relevance
Integrate evals into CI/CD gates
3. Define Quality SLOs
Examples:
p95 latency less than 500 ms
Hallucination rate less than 2 percent
Retrieval relevance score greater than 0.8
Track these in dashboards. Alert when thresholds break.
4. Close the Loop
Feed observability data back into routing and autoscaling.
Route traffic away from failing models
Scale up when latency breaches SLOs
Trade-offs to Know
More tracing means more overhead
Evals need good datasets
SLOs must balance cost and quality
Actionable Steps
Add OpenTelemetry spans for each stage
Build a small golden dataset for evals
Define 3 to 4 quality SLOs and track them
Wire alerts into Slack or PagerDuty
Feed metrics into autoscaler and router
References
OpenTelemetry
LLM Evals by OpenAI
From my experience: adding eval gates cut hallucination rate by 30 percent
Subscribe for weekly AI infra deep dives.